Understanding 3D Visualisation in VR with Eye Tracking
Description: Immersive Analytics is a quickly evolving field that unites several areas such as visualisation, immersive environments, and human-computer interaction to support human data analysis with emerging technologies. Meanwhile, eye tracking provides valuable insights into usability issues and interaction patterns, which is widely applied to immersive environments like VR.
When visualisations (usually 3D) were presented in an immersive environment like VR, users sometimes got lost and cannot see an overall trend (too big scale), while sometimes missed details (too small scale). Could we detect when users find visualisations are too complex by eye tracking? Is there a way to automatically initiate a proper scale of visualisations?
Goal:
- Set up and test experiment VR environment with eye tracking (HMD: Quest 3 + Neon XR)
- Properly conduct the user study
- Data analysis: how gaze features change across time; how gaze features correlate with task completion time, correctness rate, etc.
Supervisor: Yao Wang and Zhiming Hu
Distribution: 10% Literature Review, 50% VR Environment Implementation, 20% Data collection & processing, 20% Evaluation & analysis
Requirements: good programming skill, ideally some experience with C# (Unity) and VR.
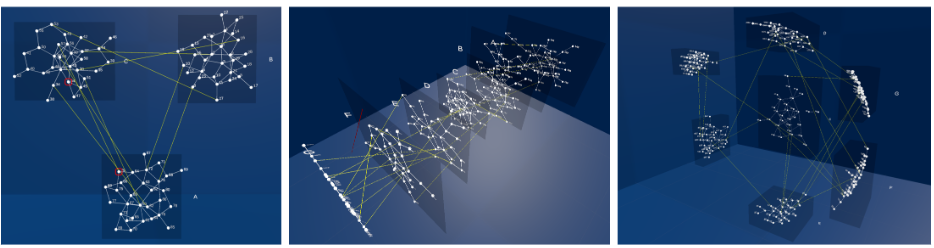
Literature: [1] Feyer, S. P., et al. "2D, 2.5 D, or 3D? an exploratory study on multilayer network visualisations in virtual reality". IEEE Transactions on Visualization and Computer Graphics 2023. Paper link.
[2] Tadeja, Slawomir Konrad, Timoleon Kipouros, and Per Ola Kristensson. "Exploring parallel coordinates plots in virtual reality." Extended Abstracts of the 2019 CHI Conference on Human Factors in Computing Systems. 2019. Paper link.
[3] Pathmanathan, Nelusa, et al. "Been There, Seen That: Visualization of Movement and 3D Eye Tracking Data from Real‐World Environments." Computer Graphics Forum. Vol. 42. No. 3. 2023. Paper link.